
In recent years, companies have shown the benefits of “copying” and sending traffic from network backbones to purpose-built monitoring devices…no interference with the existing, “live” traffic and the traffic can be analyzed in real-time or stored for later playback. However, the best approaches to “copying” and sending the traffic to be monitored has been a source of contention. As 40/100G becomes more prevalent, how the traffic is accessed will become increasingly important.
Initially, the Switched Port Analyzer (SPAN) ports were used to deliver copies of traffic to analyzers, but this has posed several problems at the 1G and 10G data rates, which likely will increase exponentially with 40/100G:
- SPAN ports are part of the switch/router and operate in much the same way as typical ports, so the data is not always an exact copy
- Traffic congestion both on the router and on the SPAN port itself can result in increased latency or the traffic to be dropped completely
- Relying on a device that could be creating the problem to help identify it can be a self-defeating exercise
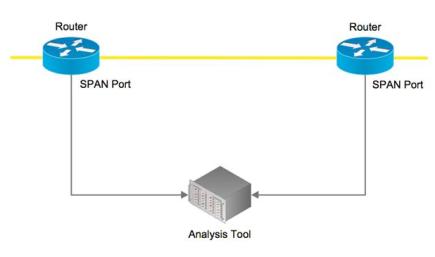
Figure 1: Network Monitoring with SPAN Ports
The practice most recently deployed, uses passive taps to send an exact copy of the traffic to the analyzer(s). While this accomplishes the task of not interfering with the “live” network, it presents issues in terms of cost and data accessibility. For example, if a network has 10x10Gbps backbones that require monitoring, the network must also have 10 analyzer ports available for the monitoring. That may not seem that daunting at first, but suppose you are a service provider or data center and you have 144/288 fibers that require monitoring. Now, you need that many analyzer ports as well, which are expensive even at 10Gbps, so what happens when the customer migrates to 40/100G?
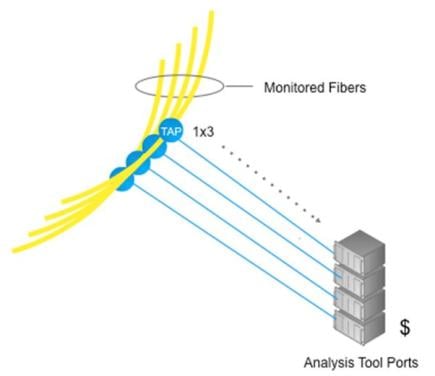
Figure 2: Network Monitoring with Passive Taps
Of course, a practical approach to this issue would be to connect the “monitor” ports from the tap, storage device ports, and a few analyzer ports to a patch panel. If a 1x3 tap is used (creates two monitoring ports for each backbone), all of the traffic can be stored for replay using one of the monitoring ports, and the analyzer(s) can be patched into the other monitoring port as needed. This enables all traffic on the network backbones to be captured while simultaneously monitoring the most critical paths (the paths of most interest) in real-time.
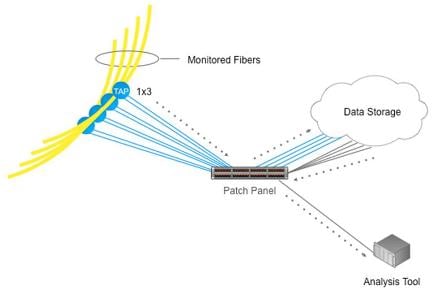
Figure 3: Network Monitoring with Passive Taps and a Patch Panel
While the approach above does solve the problem of capturing everything and reducing the cost of the analyzing equipment, it does present one key problem: manually patching in the storage device or backbone that you want to monitor can be time consuming, error prone, and increase the risk of creating a network issue. Using a Layer 1 switch or an automated patch panel can eliminate or reduce these issues. For example, connecting the “monitor” ports from the tap to a Layer 1 switch or an automated patch panel reduces the time needed to make connections because now they can be made remotely and at the click of a mouse. Furthermore, using a switch or automated patch panel reduces errors as generally some intelligence keeps the user from making an inappropriate connection (software may be intelligent enough to prevent a 10G port connection to a 100G port). In addition, making the connections inside the switch or automated patch panel reduces exposure to the elements preventing network errors that can occur, such as dirt on the end of a fiber optic connector.
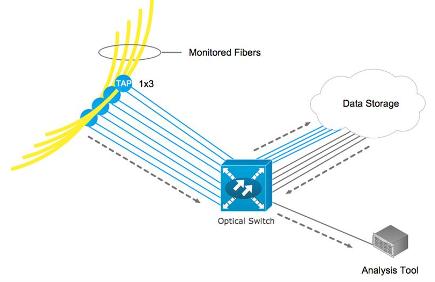
Figure 4: Network Monitoring using Passive Taps and Symmetrical Switch
Ideally, the Layer 1 switch or automated patch panel would be used to “patch” either a monitor port directly from the network or a storage device port to the analyzer as needed. As a result, one of the “monitor” ports can be statically connected through a patch panel to the storage device’s Rx port. In this case, all of the storage device’s Tx ports and the other “monitor” ports from the tap should be connected to the input ports on the Layer 1 switch or automated patch panel. With that in mind, the output ports of the Layer 1 switch or automated patch panel should be connected to the Rx port(s) on the analyzer. This approach further reduces the cost of capturing the traffic on the network because it requires a patch panel, a passive optical tap, a highly asymmetrical Layer 1 switch or automated patch panel, and only a handful of analyzer ports. The cost savings of this approach versus the previous one above is primarily due to the asymmetrical Layer 1 switch or automated patch panel cost versus a symmetrical switch.
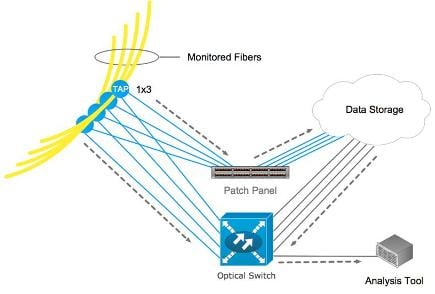
Figure 5: Network Monitoring using Passive Taps and Asymmetrical Switch
In summary, as we move toward 40/100G networks, the same problems seen in monitoring networks at 10G still exist but are compounded with the additional cost and complexity associated with 40/100G. The best and most cost-effective approach to ensuring that all data is quickly, reliably, and easily captured is to deploy passive optical taps coupled with either optical switches or automated patch panels, which connect the network backbones to storage devices and network analyzers.


