
When rolling out and maintaining a fiber optic communications system, latency is a critical factor that must be addressed. Dealing with latency issues can be very frustrating when they occur.
The timing of data transmissions is significantly important, especially as data transmission speeds increase to support today’s demands, for instance, content like streaming video, financial trading, and cloud-based services. Experiencing higher-than-normal latency in one or multiple areas of a network leads to slower round-trip signal transmission times, putting an entity at a disadvantage against competitors or resulting in unsatisfied customers/users.
While there are many factors in a network that contribute to fiber optic signal latency, including not only the fiber itself but various types of equipment installed in the network, in this article, we are focusing strictly on fiber latency - what it is, how it is calculated, tools for calculating fiber latency, and ways to address fiber latency prior to and during network deployment.
What Is Fiber Latency?
Fiber latency is the time delay that occurs when transmitting a light signal over a length of optical fiber. In other words, the time it takes for the signal to travel from one point to another within the fiber. To accurately calculate fiber latency, we need to first discuss some of the fundamentals of optical fiber technology.
The Basics of an Optical Fiber (The Short Version)
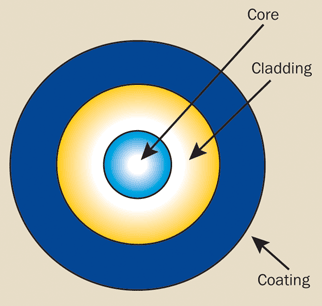
An optical fiber is a single strand of glass that, in its raw manufactured form (bare optical fiber), consists of three layers - the core, the cladding, and a thin layer of protective coating. The glass core of the fiber carries the light signal, while the glass cladding is designed to contain the light signal within the core; and lastly, the coating is simply to provide the fiber with a minimal layer of strength and protection.
An example of the construction and sizes of these segments can be seen in a typical standard G.652 single-mode optical fiber, where the core is approximately 9um in size, the cladding is 125um, and the outer coating is 125um, resulting in total fiber diameter of about 250um.
Image Courtesy of OFS® on Photonics.com
It is important to note that the glass core is manufactured with a specific Index of Refraction (IOR) value, also referred to as the Refractive Index, while the glass cladding is manufactured with a different IOR to effectively contain the signal within the core during transmission. The IOR of a medium, in this case optical fiber, plays a key role in determining the time it takes for a light signal to transmit across the fiber.
Speed of Light in an Optical Fiber and IOR
The Index of Refraction is the ratio of the speed of light in a vacuum to the speed of light in a medium like air, water, or in this case, a glass fiber. The IOR of a vacuum is 1, the IOR of air is approximately 1.0003, while the refractive index of the glass core of an optical fiber is around 1.468. What this demonstrates is that light travels faster in a vacuum than it does air and travels faster through the air than it does a medium like an optical fiber.
In free space, the speed of light is about 299,792,458 meters per second. Using this along with the IOR or the core, one can calculate the latency of a light signal in a fiber fairly easily. In the next section, we will show the equation used to calculate fiber latency along with an example using one common brand of optical fiber deployed extensively across global networks.
How to Calculate Fiber Latency
The relational equation between distance, the speed of light, and the IOR for a medium is:
Distance = Speed of Light / IOR
Thus, when calculating fiber latency, if we use the speed of light value, Corning® SMF-28® Ultra single-mode optical fiber and its core IOR value of 1.4682 at a 1550nm signal wavelength, the resulting equation is:
Distance = 299,792,458 meters per second / 1.4682
This equation results in a distance of 204,190,476 meters per second, or rounded up to approximately 204.191 meters per microsecond, supporting the fact that a light signal travels slower through a medium like a glass fiber than in free space.
Using this equation with known IOR data for any optical fiber, one can then calculate a distance by inputting a latency value or determine the latency value for a specified distance.
Technical Note: Since the IOR changes when transmitting different wavelengths, most optical fiber manufacturers provide IOR values at specific wavelengths like 1310nm and 1550nm for single-mode fibers. This specification is available in the technical data sheets they provide for each specific fiber.
Since it can be cumbersome to find and gather that type of data, there are tools available like the Optical Fiber Latency Calculator that have already compiled and included this data for many popular single-mode and multimode fibers from leading manufacturers, enabling you to calculate latency values or distances quickly and easily.
Factors that Affect Fiber Latency
In most instances, distance is always the primary factor and sometimes even the only factor considered by those dealing with and addressing fiber latency. After all, physical distance is indeed a significant factor and also most of today’s fiber optic test devices that are used to test and characterize optical fibers, OTDRs as an example, provide distance or length-based results as opposed to time delay.
However, the physical distance or length of a fiber isn’t the only factor to consider when determining fiber latency. Let’s take a look at just a few of the primary fiber-specific factors that can affect or impact latency values in a network and must be taken into consideration.
Fiber Distance / Length
As noted above, the physical distance of a length of fiber is the primary factor in terms of the resulting latency. Simply put, it takes a longer time for a signal to travel over a 10km distance of fiber than it does over a 5km distance.
Whenever more fiber is added into a span, it will result in a greater latency value. For example, the total fiber distance between two points in a network maybe 100km, but a dispersion compensating fiber may be required in order to minimize the negative effects of Chromatic Dispersion. The length of dispersion compensating fiber will depend on its negative dispersion characteristics, but in some cases, it can require as much as 10% of the total fiber length. In this example, that adds 10km, so the resulting length is now 110km. It should also be noted that simply adding patch cables when connecting gear or structured cabling between racks also adds more fiber that factors into the total latency value.
In latency-driven networks, engineers go to great lengths to try and equalize these physical fiber lengths coming into the data center as well as inside the facility when attempting to synchronize signal timing or provide matching performance between multiple fibers.
In addition to structured cabling, engineers will often deploy optical time delays, which are fibers spooled to precision lengths that allow for fine-tuning of fiber distances and thus help to accurately adjust or equalize latency values.
Fiber Type or Brand
Since each fiber manufacturer has different approaches and recipes for producing their fibers, one must consider the fiber type or brand when thinking about fiber latency. As an example, while one fiber may have a refractive index of 1.468 @ 1550nm, a comparable G.652D fiber from another manufacturer may be slightly lower by 1.467 @1550nm.
With refractive index being a part of the equation when determining fiber latency, there will be a minimal latency improvement utilizing the latter fiber when simply considering only the fiber itself. However, in the scope of total network performance, in addition to fiber latency, all performance factors (like loss/attenuation) will also be considered and play important roles, so a lower refractive index doesn’t mean that fiber is necessarily the best choice for the network.
Because different fiber types and brands all have different refractive indices and at differing wavelengths, it’s important to test and evaluate different types of fiber in the lab setting when determining the best fiber match for a network. Utilizing professional fiber network and link emulators for R&D and certification efforts provides the most accurate way to exactly emulate real fiber performance characteristics and expected latency characteristics in the test environment, as you can specify various types and lengths for evaluation purposes.
Transmitted Signal Wavelength
Different wavelengths of light have different IOR values when transmitted in an optical fiber, so with the refractive index being a key component in the latency equation, the latency value will change based on the wavelength being transmitted. The optical fiber manufacturers typically provide a typical IOR value specification for single mode fibers at 1310nm and 1550nm, while multimode fibers are specified at 850nm and 1300nm. Lastly, the IOR values provided for fibers typically refer to the effective group index of refraction.
Temperature
A little-known factor, but changes in temperature have an impact on the properties of glass. While it is of a lesser impact in the scope of fiber latency compared to other factors, a change of 1℃ in temperature will change the value of the IOR by 1 digit in the 5th decimal place. A fiber in a non-temperature controlled hut out in a network may see a temperature change from 20℉ in the winter to 85℉ in the summer, that equates to a 36℃ change meaning an IOR changes from 1.46820 to 1.46856. Again, not an overly significant change that most people will not be concerned about, but for a financial trading network where every fraction of a second matters, these changes may also be accounted for accordingly.
Using Different Test Devices and Performance Settings
It is a known and expected fact that using different devices to test fiber lengths may and often do produce different results. Like most products available in the world, each test device manufacturer builds their own device in a different manner in terms of parts, lasers, configurations, software, and tolerances. While fundamentally similar and often based on the same technology, these differences along with the types of features and the specific settings a user selects often lead to differing results.
Take an OTDR for example. Two comparable types from leading manufacturers are both great instruments, but due to simple differences in software or settings a user chooses, one may test a length to 20,004 meters while the other may test it to 20,001 meters. One might say that’s only a difference of 3 meters and for the majority of applications is perfectly fine, but for a latency-driven entity like a high speed financial trader, 3 meters is a lot when they are attempting to achieve tolerances to inches or less if possible.
Tools for Calculating and Emulating Fiber Latency
Since the fiber itself plays such a critical role in the overall latency of a network, accurately calculating its latency values and determining its overall impact is very important when designing new networks, architecting fiber routes, and certifying new equipment to be used in the network. Fortunately, there are some valuable and proven tools available for engineers seeking to address this effectively.
Optical Fiber Latency Calculator
Available from M2 Optics, this free and downloadable tool has compiled the refractive index specifications for the most common types and brands of single mode and multimode fibers from leading manufacturers. It allows a user to enter a distance and it will calculate the resulting fiber latency in microseconds or nanoseconds, or the user can enter the latency value and calculate the resulting fiber distance.
This tool is a must-have for anyone needing to perform quick latency calculations, evaluating latency impacts of various fibers, or learning about fiber latency. Additionally, M2 updates the tool periodically to include additional or new fibers, adding further value to the user.
View/Download the Optical Fiber Latency Calculator
Fiber Lab - Network and Link Emulators
For engineers working in the test lab that require spools of optical fiber for testing and validating optical performance characteristics and latency values, Fiber Lab solutions from M2 Optics provide the most accurate and efficient approach for exactly emulating the physical fiber architecture.
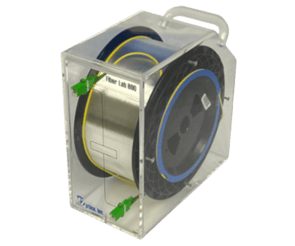
Shown: Portable Fiber Lab 800 with 25km of Corning® SMF-28® Ultra SMF
Customized to each user’s needs, Fiber Labs offer all fiber types, lengths (by distance or delay value), and setup configurations in a wide selection of rack-mount or portable enclosures. In addition to protecting the fiber and connectors during use, they provide consistent results in the most organized and professional manner. Since these emulators include the complete length(s) of real fiber, the user not only benefits from receiving the actual fiber latency values but all of the other important fiber characteristics like chromatic dispersion that are factors in fiber-based signal transmission. In other words, using real fiber exactly replicates the real fiber network span.
Whether an engineer is evaluating several fiber types to determine the best match for a future network or emulating a complete existing network when certifying new gear prior to deployment, Fiber Labs are the trusted choice globally by leading entities for the value they deliver.
Learn More
If you would like more information about calculating fiber latency, wish to receive further technical specifications for any fibers, or need to acquire fiber for emulating a network in the lab, contact our team of experts today at M2 Optics.


