Why the Index of Refraction is a Key Technical Parameter To Understand

Why the Index of Refraction is a Key Technical Parameter To Understand
Topics: optical fiber, index of refraction, optical fiber reference guide, refractive index, IOR
Data Centers and AI – Simulating Fiber Link Latency & Performance is Crucial
Topics: network simulation, latency, AI, data centers
For universities and research institutions developing, evaluating, and testing fiber optic technology to advance global communications, using optical fibers to accurately simulate span performance and latency in the lab is often an essential step in projects. This brief article discusses how customized Fiber Lab solutions from M2 Optics help researchers and professors successfully address the precision, consistency, and protection challenges that arise when working with bare optical fibers.
Topics: optical fiber, network simulation, latency, universities and research
From supporting live online classes to delivering reliable high-speed internet services to students and administration, optical fiber networks play an essential role across university campuses. Discover the numerous benefits of implementing fiber monitoring systems and how they can enhance IT and communications services.
Topics: fiber optic testing, optical fiber, fiber monitoring, university campus
There's an old business saying, "If you are not innovating, you are dying." Similar to other industry sectors, the telecommunications and fiber optic technology arena is no different. In this rapidly growing and evolving landscape where network equipment manufacturers and service providers are racing to deliver ever-increasing amounts of data to satisfy global demands, staying ahead of the curve and the competition is more than just a business strategy - it's essential. No two networks are exactly alike and various challenges arise frequently that companies must be able to successfully navigate. Differentiation is a key element in a highly competitive market – those who can take new products and enhancements to market faster, find creative solutions to quickly overcome unexpected issues, and reduce supply lead times for clients are just a few examples of ways companies can gain a competitive advantage.
Topics: 3D Printing, 3D design, 3D design and printing servives, 3D printing and design for Telecom, 3d printing and design services for Fiber Optics
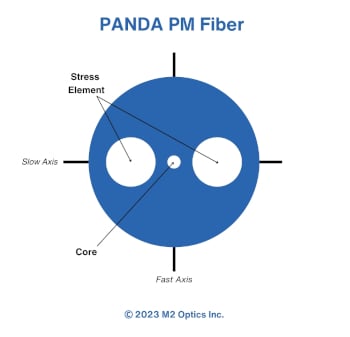
What are Polarization-Maintaining (PM) Optical Fibers?
Topics: optical fiber, polarization-maintaining optical fiber, pm fiber
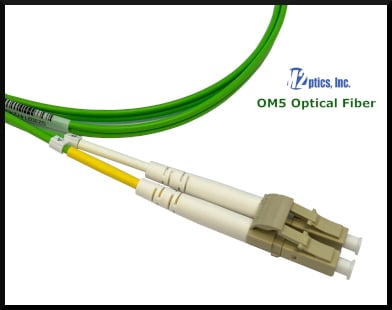
OM5 optical fiber is the latest iteration in the family of multimode fibers that includes prior types OM1, OM2, OM3, and OM4. Formally introduced a few years ago in 2016 by the Telecommunications Industry Association (TIA) and the International Electrotechnical Commission (IEC), it is also known as "Wideband Multimode Fiber" (WBMMF) and was specifically designed to enhance optical transmission performance in both data center and enterprise networks.
Topics: multimode fiber, OM5 wideband multimode optical fiber, OM5
The transportation and highway infrastructure is critical to the flow of goods, people, and resources throughout the country. As we learned during the pandemic, transportation was the lynchpin to delivering goods to stores, homes, or people in need.
Topics: fiber monitoring, cybersecurity, transportation network

Fiber optic networks are essential to the functioning of blockchain technology. In short, blockchain is a decentralized system that relies on a distributed network of computers to maintain a digital ledger of all transactions. Allowing for secure, transparent, and immutable record-keeping, this technology has a wide range of applications in finance (cryptocurrency for example), supply chain management, and other industries. Offering high-speed, low-latency data transmission capabilities, fiber optic networks are the ideal choice for supporting the complex and data-intensive operations of blockchain technology.
Topics: fiber optic testing, network simulation, blockchain
Fiber-to-the-home (FTTH), also known as fiber-to-the-premises (FTTP), is when optical fiber is installed and connected directly to a single structure, such as a home, apartment, or business. This approach for delivering high-speed internet services and greater bandwidth continues to excel globally as it offers superior performance compared to non-fiber coaxial cable and DSL (Digital Subscriber Line) connections.
Topics: WDM, fiber optic testing, optical fiber, otdr, PON, optical switching, fiber optic training, fiber lab, network simulation, optical taps, fiber monitoring, optical time delays, Optical fiber market, fiber optic cable, fiber optic networks

 Headquarters
5621 Departure Dr, Ste 117
Raleigh, NC 27616, USA
 Call Us
Phone: 1-919-342-5619
Toll Free: 866-269-2902
 Email Us